Summary
In 2015, the Group persisted in its established strategic direction, continually developed and innovated, and pragmatically implemented its comprehensive in-depth reform and Internet-oriented transformation, achieving a stable growth in its overall operating results. The Group’s operating revenues in 2015 were RMB331,202 million, an increase of 2.1% from 2014; service revenues1 were RMB293,266 million, an increase of 2.0% from 2014; operating expenses were RMB304,760 million, an increase of 3.0% from 2014; profit attributable to equity holders of the Company was RMB20,054 million, an increase of 13.4% from 2014; basic earnings per share were RMB0.25; EBITDA2 was RMB94,106 million, a decrease of 0.8% from 2014 and the EBITDA margin3 was 32.1%.
Operating Revenues
In 2015, while proactively tackling various challenges brought by the policies such as the value-added tax (“VAT”) reform, “speed upgrade & tariff reduction” and “handset data traffic carried forward”, the Group continued to optimise its business structure and achieved a stable growth in its operating revenues. Operating revenues in 2015 were RMB331,202 million, an increase of 2.1% from 2014. Of this, the total mobile revenues were RMB156,529 million, an increase of 3.2% from 2014; the total wireline revenues were RMB174,673 million, an increase of 1.1% from 2014.
- Service revenues were calculated based on operating revenues minus sales of mobile terminals (2015: RMB32,026 million; 2014: RMB31,343 million), sales of wireline equipment (2015: RMB4,430 million; 2014: RMB3,956 million) and other non-service revenues (2015: RMB1,480 million; 2014: RMB1,716 million).
- EBITDA was calculated based on operating revenues minus operating expenses plus depreciation and amortisation. As the telecommunications business is a capital intensive industry, capital expenditure, the level of gearing and finance costs may have a significant impact on the net profit of companies with similar operating results. Therefore, we believe EBITDA may be helpful in analysing the operating results of a telecommunications service provider such as the Company. Although EBITDA has been widely applied in the global telecommunications industry as a benchmark to reflect operating performance, debt raising ability and liquidity, it is not regarded as a measure of operating performance and liquidity under generally accepted accounting principles. It also does not represent net cash from operating activities. In addition, our EBITDA may not be comparable to similar indicators provided by other companies.
- EBITDA margin was calculated based on EBITDA divided by service revenues.
The following table sets forth a breakdown of the operating revenues of the Group for 2014 and 2015, together with their respective rates of change:
| For the year ended 31 December | |||
| (RMB millions, except percentage data) | 2015 | 2014 | Rates of change |
|---|---|---|---|
| Wireline voice | 29,610 | 33,587 | (11.8%) |
| Mobile voice | 48,983 | 54,673 | (10.4%) |
| Internet | 126,546 | 112,431 | 12.6% |
| Value-added services | 39,044 | 38,419 | 1.6% |
| Integrated information application services | 27,299 | 26,939 | 1.3% |
| Telecommunications network resource services and lease of network equipment | 17,635 | 17,332 | 1.7% |
| Others | 42,085 | 41,013 | 2.6% |
| Total operating revenues | 331,202 | 324,394 | 2.1% |
Wireline Voice
In 2015, revenue from wireline voice services was RMB29,610 million, a decrease of 11.8% from RMB33,587 million in 2014, accounting for 8.9% of the Group’s operating revenues. Declining revenue contribution from wireline voice services effectively mitigated operating risks.
Mobile Voice
In 2015, being affected by the substitution effect of mobile Internet services, such as OTT, revenue from mobile voice services was RMB48,983 million, a decrease of 10.4% from RMB54,673 million in 2014, accounting for 14.8% of the Group’s operating revenues.
Internet
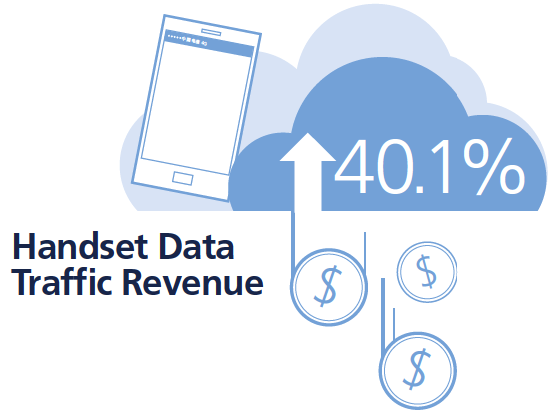
In 2015, revenue from Internet access services was RMB126,546 million, an increase of 12.6% from RMB112,431 million in 2014, accounting for 38.2% of the Group’s operating revenues. The Group proactively leveraged the advantage of its broadband network, promoted access bandwidth upgrades for subscribers, launched reasonably flexible pricing plans, persisted in rational competition and profitable development. At the end of 2015, the number of wireline broadband subscribers of the Group reached 113 million, with a net increase of 6.11 million. The wireline broadband revenue of the Group was RMB74,285 million, an increase of 1.1% from 2014. The Group achieved rapid growth in the volume of and revenue from mobile data traffic, effectively driven by further promoting the precision management of data traffic operations and, at the same time, increasing sales at lower unit prices. Revenue from mobile Internet access services was RMB50,694 million, an increase of 34.1% from 2014. Of this, revenue from handset data traffic was RMB47,770 million, an increase of 40.1% from 2014.
Valued-Added Services
In 2015, revenue from value-added services was RMB39,044 million, an increase of 1.6% from RMB38,419 million in 2014, accounting for 11.8% of the Group’s operating revenues. Of this, the revenue from wireline value-added services was RMB21,529 million, an increase of 16.8% from 2014, mainly benefitted from that the Group firmly seized the strategic opportunities of the national “Internet+” action plan to achieve rapid growth in the IDC and IPTV (e-Surfing HD) services. Revenue from mobile valueadded services was RMB17,515 million, a decrease of 12.4% from 2014, mainly due to the decrease in revenue from traditional value-added services, such as short and multimedia messaging services.
Integrated Information Application Services
In 2015, revenue from integrated information application services was RMB27,299 million, an increase of 1.3% from RMB26,939 million in 2014, accounting for 8.3% of the Group’s operating revenues. Of this, revenue from wireline integrated information application services was RMB20,505 million, an increase of 4.5% from 2014. The increase in revenue was mainly due to the stable development of IT Services and Applications. Revenue from mobile integrated information application services was RMB6,794 million, a decrease of 7.2% from 2014. The decline was mainly due to the decrease in the volume of traditional information inquiry services.
Telecommunications Network Resource Services and Lease of Network Equipment
In 2015, revenue from telecommunications network resource services and lease of network equipment was RMB17,635 million, an increase of 1.7% from RMB17,332 million in 2014, accounting for 5.3% of the Group’s operating revenues. Revenue from lease of mobile network equipment was RMB421 million, a decrease of 9.1% from 2014.
Others
In 2015, revenue from other services was RMB42,085 million, an increase of 2.6% from RMB41,013 million in 2014, accounting for 12.7% of the Group’s operating revenues. Revenue from other mobile services was RMB32,122 million, an increase of 2.4% from 2014, the major item of which was the sales of mobile terminals.
Operating Expenses
The Group reinforced the efforts in management and control of cost, optimised resources allocation, continuously promoted the transformation of sales and marketing models, and enhanced and promoted its market competitiveness. In 2015, operating expenses of the Group were RMB304,760 million, an increase of 3.0% compared with RMB295,886 million in 2014. Operating expenses accounted for 92.0% of the Group’s operating revenues, an increase of 0.8 percentage point from 2014.
The following table sets forth a breakdown of the operating expenses of the Group in 2014 and 2015 and their respective rates of change:
| For the year ended 31 December | |||
| (RMB millions, except percentage data) | 2015 | 2014 | Rates of change |
|---|---|---|---|
| Depreciation and amortisation | 67,664 | 66,345 | 2.0% |
| Network operations and support expenses | 81,240 | 68,651 | 18.3% |
| Selling, general and administrative expenses | 54,472 | 62,719 | (13.1%) |
| Personnel expenses | 52,541 | 50,653 | 3.7% |
| Other operating expenses | 48,843 | 47,518 | 2.8% |
| Total operating expenses | 304,760 | 295,886 | 3.0% |
Depreciation and Amortisation
In 2015, depreciation and amortisation was RMB67,664 million, an increase of 2.0% from RMB66,345 million in 2014, accounting for 20.4% of the Group’s operating revenues. As the Group increased investment in 4G and fibre broadband network, depreciation and amortisation increased correspondingly with the expansion of the assets scale.
Network Operations and Support Expenses
In 2015, network operations and support expenses were RMB81,240 million, an increase of 18.3% from RMB68,651 million in 2014, accounting for 24.5% of the Group’s operating revenues. The growth was due to the newly added tower usage fee in 2015. In addition, with the expansion of network assets, the Group reasonably increased network operations expenses to enhance network quality and, at the same time, continuously strengthened cost management and control, improving the utilisation efficiency of resources. As such, the increase in network operations and support expenses was evidently slower than that in 2014.
Selling, General and Administrative Expenses
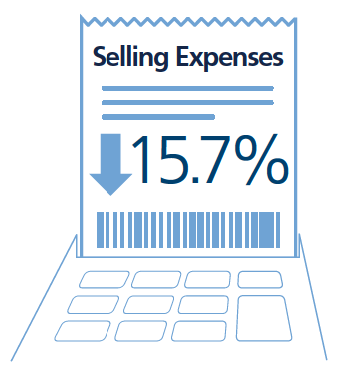
In 2015, selling, general and administrative expenses amounted to RMB54,472 million, a decrease of 13.1% from RMB62,719 million in 2014, accounting for 16.4% of the Group’s operating revenues. Of this, selling expenses were RMB45,943 million, a decrease of 15.7% compared with 2014. The decline was mainly attributable to the fact that the Group continuously promoted the transformation of sales and marketing models, reduced selling expenses, and improved the utilisation efficiency of marketing resources. Commission and service expenses for third parties amounted to RMB26,651 million, a decrease of 6.0% from 2014. Advertising and promotion expenses amounted to RMB19,291 million, a decrease of 26.2% from 2014, of which the terminal subsidies amounted to RMB11,620 million, a decrease of 24.3% from 2014.
Personnel Expenses
In 2015, personnel expenses were RMB52,541 million, an increase of 3.7% from RMB50,653 million in 2014, accounting for 15.9% of the Group’s operating revenues. For details of the number of employees, remuneration policies and training schemes, please refer to the Human Resources Development Report in this annual report.
Other Operating Expenses
In 2015, other operating expenses were RMB48,843 million, an increase of 2.8% from RMB47,518 million in 2014, accounting for 14.8% of our operating revenues. The cost of mobile terminal equipment sold amounted to RMB30,867 million, an increase of 3.0% from 2014.
Net Finance Costs
In 2015, the Group’s net finance costs were RMB4,273 million, a decrease of 19.2% from RMB5,291 million in 2014. The decrease was mainly due to the fact that the interest rate of the deferred consideration of Mobile Network Acquisition decreased from 6.25% per annum in 2014 to 5.11% per annum in 2015 (adjusted in accordance with a 5 basis points premium to the yield of the 5-year super AAA rated Medium Term Notes once a year pursuant to the agreement). Net exchange losses were RMB75 million in 2015. The fluctuation of foreign exchange gain or loss was mainly caused by the depreciation of the RMB exchange rate against the US Dollars.
Profitability Level
Income Tax
The Group’s statutory income tax rate is 25%. In 2015, the Group’s income tax expenses were RMB6,551 million with the effective income tax rate of 24.5%. The difference between the effective income tax rate and the statutory income tax rate was mainly due to the preferential income tax rate, which was lower than the statutory income tax rate, enjoyed by some of our branches with operations in the western region of China and some of our subsidiaries.
Profit Attributable to Equity Holders of the Company
In 2015, profit attributable to equity holders of the Company was RMB20,054 million, an increase of 13.4% from RMB17,680 million in 2014.
Disposal of Certain Telecommunications Towers and Related Assets
Pursuant to the transfer agreement (“Transfer Agreement”) entered into by the Group and China Tower Corporation Limited (“China Tower”) on 14 October 2015, the Group sold certain telecommunications towers and related assets (“Tower Assets”) (“Tower Assets Disposal”) and injected cash to China Tower in return for new shares (“Consideration Shares”) issued by China Tower.
By 31 December 2015, China Tower has issued 33.097 billion Consideration Shares to the Group at an issue price of RMB1.00 per share pursuant to the Transfer Agreement in return for RMB30.131 billion of the Tower Assets and RMB2.966 billion cash from the Group.
Upon the issuance of the Consideration Shares by China Tower, the Group, China Unicom, China Mobile and China Reform Holding Company Limited hold 27.9%, 28.1%, 38.0% and 6.0% of the share capital of China Tower, respectively.
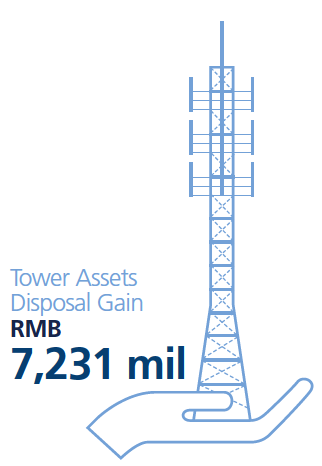
The Company realised a gain (subject to deduction of relevant expenses and taxes) from the Tower Assets Disposal, which was calculated based on the surplus of the final consideration amount for the Tower Assets Disposal over the book value of the assets as at the completion date and the final gain recognised was RMB7,231 million. As the Group held 27.9% of the share capital of China Tower following the completion of the Tower Assets Disposal, 72.1% of the aforesaid gain had been recognised at the completion date of the Tower Assets Disposal in the consolidated statement of comprehensive income and the remaining 27.9% of the aforesaid gain is deferred over the remaining useful life of the Tower Assets.
Capital Expenditure and Cash Flows
Capital Expenditure
In 2015, the Group increased its capital expenditure on 4G and fibre broadband network and fully upgraded the capability of the network to lay down a strong foundation of the scale development of core services and further market competitiveness. In 2015, capital expenditure of the Group was RMB109,094 million, an increase of 41.9% from RMB76,889 million in 2014.
Cash Flows
In 2015, net increase in cash and cash equivalents for the Group was RMB11,309 million, while the net increase in cash and cash equivalents was RMB4,370 million in 2014.
The following table sets forth the cash flow position of the Group in 2014 and 2015:
| For the year ended 31 December | ||
| (RMB millions) | 2015 | 2014 |
|---|---|---|
| Net cash flow from operating activities | 108,750 | 96,405 |
| Net cash used in investing activities | (102,250) | (81,708) |
| Net cash from/(used in) financing activities | 4,809 | (10,327) |
| Net increase in cash and cash equivalents | 11,309 | 4,370 |
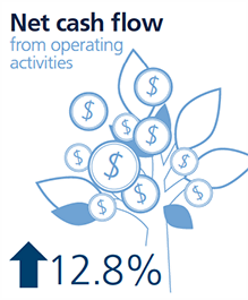
In 2015, the net cash inflow from operating activities was RMB108,750 million, an increase of 12.8% from 2014, which was mainly due to the increase in operating revenues and enhanced collection of accounts receivable.
In 2015, the net cash outflow used in investing activities was RMB102,250 million, an increase of 25.1% from 2014, which was mainly due to the increase of capital expenditure for the year.
In 2015, the net cash inflow from financing activities was RMB4,809 million. In 2014, the net cash outflow used in financing activities was RMB10,327 million. The reason for the fluctuation was mainly due to the issuance of shortterm commercial papers and the newly originated government loans with belowmarket interest rate during the year.
Working Capital
The Group consistently upheld prudent financial principles and strict fund management policies. At the end of 2015, the Group’s working capital (total current assets minus total current liabilities) deficit was RMB177,821 million, an increase in deficit of RMB31,039 million from RMB146,782 million in 2014. As at 31 December 2015, the Group’s unutilised credit facilities were RMB128,839 million (2014: RMB130,488 million). Given the stable net cash inflow from operating activities and the sound credit record, the Group has sufficient working capital to satisfy the operation requirement. At the end of 2015, the Group’s cash and cash equivalents amounted to RMB31,869 million, amongst which cash and cash equivalents denominated in Renminbi accounted for 92.6% (2014: 93.1%).
Assets and Liabilities
In 2015, the Group continued to maintain a solid financial position. At the end of 2015, the total assets of the Group increased to RMB629,561 million from RMB561,274 million at the end of 2014, which was mainly due to the increase of capital expenditure and the valuation surplus of Tower Assets injected to China Tower. Total indebtedness increased to RMB116,669 million from RMB106,552 million at the end of 2014. The ratio of the Group’s total indebtedness to total assets decreased to 18.5% at the end of 2015 from 19.0% at the end of 2014.
Indebtedness
The indebtedness analysis of the Group as of the end of 2014 and 2015 is as follows:
| For the year ended 31 December | ||
| (RMB millions) | 2015 | 2014 |
|---|---|---|
| Short-term debt | 51,636 | 43,976 |
| Long-term debt maturing within one year | 84 | 82 |
| Long-term debt and payable | 64,830 | 62,494 |
| Finance lease obligations (including current portion) | 119 | - |
| Total debt | 116,669 | 106,552 |
By the end of 2015, the total indebtedness of the Group was RMB116,669 million, an increase of RMB10,117 million from the end of 2014, which was mainly due to the issuance of short-term commercial papers and newly originated national policyrelated loans with below-market interest rate. Of the total indebtedness of the Group, loans denominated in Renminbi, US Dollars and Euro accounted for 99.4% (2014: 99.2%), 0.4% (2014: 0.5%), and 0.2% (2014: 0.3%), respectively. 46.3% (2014: 41.3%) of the indebtedness are loans with fixed interest rates, while the remainders are loans with floating interest rates.
As at 31 December 2015, the Group did not pledge any assets as collateral for debt (2014: Nil).
Most of the Group’s revenue receipts from and payments made for its business were denominated in Renminbi, therefore the Group did not have significant risk exposure to foreign exchange fluctuations.
Contractual Obligations
| (RMB millions) | Total | 1 January 2016 - 31 December 2016 | 1 January 2017 - 31 December 2017 | 1 January 2018 - 31 December 2018 | 1 January 2019 - 31 December 2019 | 1 January 2020 - 31 December 2020 | There-after |
|---|---|---|---|---|---|---|---|
| Short-term debt | 51,967 | 51,967 | - | - | - | - | - |
| Long-term debt and payable | 71,295 | 2,597 | 64,345 | 251 | 250 | 267 | 3,585 |
| Operating lease commitments | 14,448 | 3,452 | 2,564 | 2,006 | 1,532 | 1,171 | 3,723 |
| Capital commitments | 10,148 | 10,148 | - | - | - | - | - |
| Total contractual obligations | 147,858 | 68,164 | 66,909 | 2,257 | 1,782 | 1,438 | 7,308 |
Note: Amounts of short-term debt, and long-term debt and payable include recognised and unrecognised interest payable, and are not discounted.